

Donald Trump likes to talk in extremes. A stock market rally is the best ever. A decent economy is the best ever.
The president uses the stock market as a personal measure on his performance. But he doesn’t like to talk about slumps.
But the market is in one now, mostly because of negative reaction to tariff threats against Canada, Mexico and China — and maybe more.
💰💸 Don’t miss the move: Subscribe to TheStreet’s free daily newsletter💰💸
Futures trading overnight, however, suggested stocks would open lower again on Thursday. That would be after some earnings disappointments Wednesday afternoon from Marvell Technology (MRVL) and database developer MongoDB (MDB) .
U.S. markets surged after the Nov. 5 election. But they started to show signs of toppiness before Christmas. In fact, the Dow Jones Industrial Average peaked on Dec. 4. The Nasdaq Composite’s peak came on Dec. 16.
Related: Crashing stocks? What you should do now
The key date, at least for now, seems to be Feb. 19. That was the day the Nasdaq-100 Index, which concentrates on the hottest Nasdaq stocks, hit its all-time closing high of 22,176.
The Standard & Poor’s 500’s peak also came on Feb. 19, at 6,144.
It’s been a slog for stocks generally since then except for Wednesday’s big rebound. The bounce up came after the president’s address to Congress on Tuesday and then his decision to delay tariffs that would affect U.S. automakers until April 2.
The biggest earnings reports on the week are due after Thursday’s close, from Broadcom (AVGO) and Costco Wholesale (COST) .
Those reports will come along with the Labor Department’s weekly report on jobless claims. On Friday, the Labor Department releases its monthly jobs report.
Related: Stock Market Today: Stocks resume slide on tariff, growth concerns
How bad is the slump?
Startling and painful, but, sorry, it’s just not awful. It has been, in fact, a fairly normal pullback that happens a couple of times a year.
There is a caveat, however. It’s a fairly normal pullback — so far.
Here’s the data — how four widely watched indicators have fared.
S&P 500. Date of peak: Feb. 19 at 6,144. Change from peak since: down 4.9% after Wednesday’s close. On Tuesday, the loss was 6.7%. Year-to-date change as of Wednesday: -0.7%.
Nasdaq-100. Date of Peak: Feb. 19 at 22,176. Change from peak as of Wednesday close: about 7%. Change after Tuesday’s trading: about 9.7%. That was quite close to a correction level. A market correction is popularly defined as a 10% decline from a recent peak. Year-to-date change as of Wednesday: -1.8%.
More Tech Stocks:
- Nvidia-backed startup could be hottest tech IPO of the year
- Sorry Elon, most Americans are uneasy with this Tesla technology
- Cathie Wood unveils 5 crucial technology trends
Nasdaq Composite Index. Date of peak: Dec. 16 at 20,174. (For those historically minded, Dec. 16 was the 80th anniversary of the start of World War II’s Battle of the Bulge.) Change from peak as of Wednesday’s close: down 8%. Change after Tuesday’s trading: down 11%. Year-to-date change: 1.5%.
Dow Jones Industrial Average. Date of peak: Dec. 4 at 45,014. Change from peak as of Wednesday’s close: down 4.5%. Change after Tuesday’s trading: down 5.9%. Year-to-date change: 1.1%.
What constitutes really awful? Try the 2007-2009 slump, which saw the S&P 500 fall nearly 57% from a peak in October 2007 to the March 2009 bottom. Or the Covid-19 crash, when the S&P fell 33.9% in less than a month.
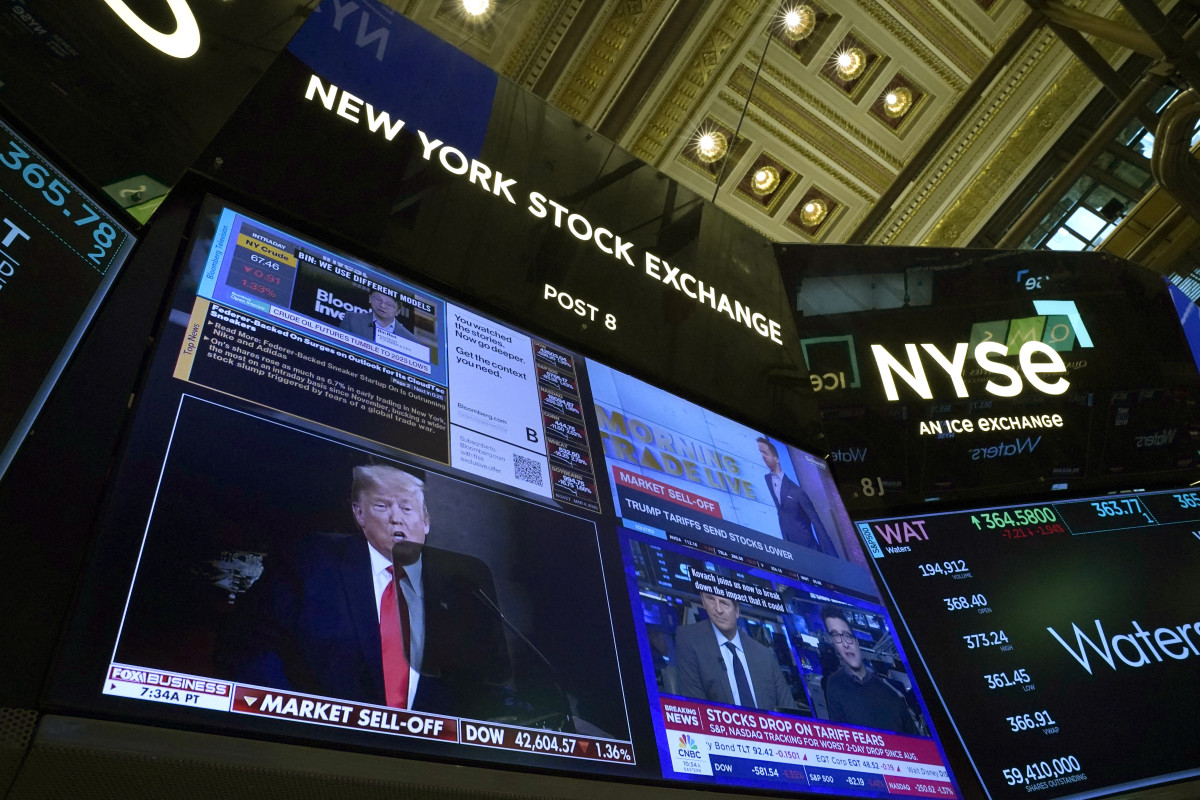 The floor of the New York Stock Exchange on Tuesday.
TIMOTHY A. CLARY/Getty Images
The Magnificent 7 are a big problem
One doesn’t have to look far to find out which group of stocks is most visible in the selloff: the so-called Magnificent 7 stocks. The market capitalizations of these seven represented more than 31% of the total market cap of the S&P 500 on Feb. 28.
Of these, the biggest decliner is Tesla (TSLA) , down 27.6% in February alone and off nearly 31% year to date. Its market capitalization is $898 billion, down from nearly $1.3 trillion on Dec. 31.
Only Facebook parent Meta Platforms (META) is bucking the trend. It’s up 12.1% for the year. Apple (AAPL) is off 5.9%. Nvidia (NVDA) is down 12.7%.
The group as a whole basically was the stock market in 2023 and 2024, pulling in money from around the world. The other three are Amazon.com (AMZN) , Microsoft (MSFT) and Google parent Alphabet (GOOGL) .
This year, there has been new competition: Germany, France and Hong Kong. Market indexes for all three countries are up at least 11% this year.
Related: Veteran fund manager unveils eye-popping S&P 500 forecast